Stay in Savannah Social Media
Facebook Posts
Facebook engagements grew 770% from 2018 (8,349) to 2019 (73,280).
Facebook organic reach grew 519% from 2018 (176,536) to 2019 (1,093,192).
This growth is a direct result of applying marketing strategies based on performance metrics. Contests, give-a-ways, user generated content, and establishing influential partnerships were utilized.
Stay in Savannah facebook page
An American Idol
10/01/2019
Total Reach: 37,693
Total Impressions: 51,833
Engagements: 5,972
Followers: 7,826
Spring Giveaway
04/17/2019
Total Reach: 20,893
Total Impressions: 29,915
Engagements: 2,776
Followers: 7,253
Mrs. Wilkes Video
09/09/2019
Total Reach: 8,140
Total Impressions: 11,512
Engagements: 797
Followers: 7,783
St. Patrick’s Day
03/11/2019
Total Reach: 7,263
Total Impressions: 8,916
Engagements: 266
Followers: 7,223
River Street Video
06/06/2019
Total Reach: 7,768
Total Impressions: 9,765
Engagements: 263
Followers: 7,502
Lady & The Tramp
11/19/2018
Total Reach: 24,175
Engagements: 9,591
Followers: 6,936
Instagram Posts
Halloween
10/31/2019
Likes: 467
Comments: 6
Followers: 2,597
Tybee Pier
11/10/2019
Likes: 464
Comments: 6
Followers: 2,641
Stone Stairs
02/16/2020
Likes: 336
Comments: 9
Followers: 3,847
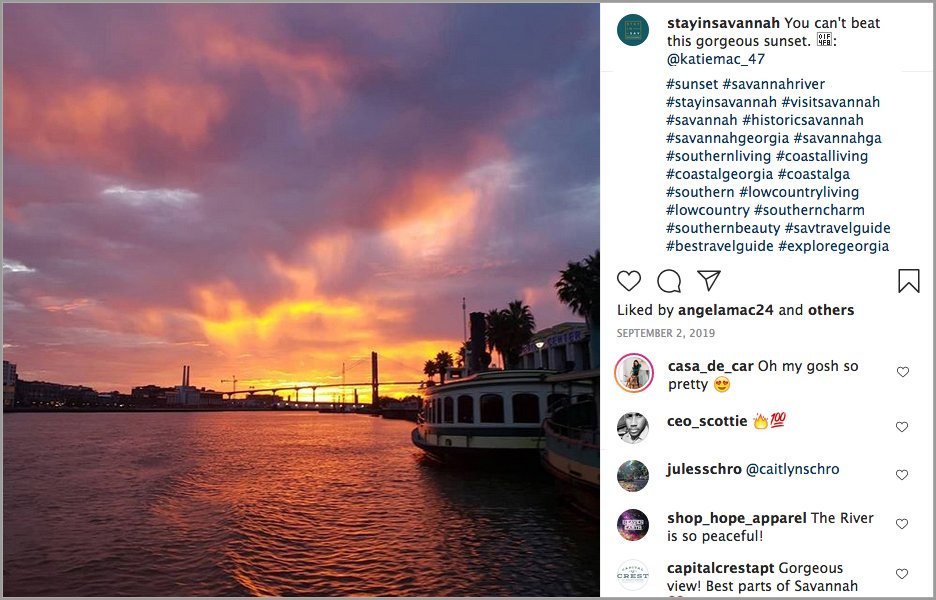
Savannah River
09/02/2019
Likes: 322
Comments: 9
Followers: 2,521
The 1790 House
10/23/2019
Likes: 308
Comments: 10
Followers: 2,582
The Artillery Bar
12/06/2019
Likes: 297
Comments: 18
Followers: 2,865
Fall Season
10/23/2018
Likes: 281
Comments: 54
Followers: 1,621


